
Dollar Cost Averaging Into Gold and Silver: A Stacker's Guide
How stackers buy gold and silver on a schedule, why a falling price lowers your average cost, and how to plan and track it without a spreadsheet.
Ask a room of silver stackers how they buy and a lot of them will give the same answer: a little every month, whatever the price is doing. That habit has a name, dollar cost averaging, and it’s one of the most common ways people build a stack of gold or silver over time.
This guide covers how dollar cost averaging works with bullion, why a falling price is good news for someone doing it, and how the DCA calculator in My Coin Stack lets you plan a schedule and see where it leads before you spend anything.
What dollar cost averaging means
Dollar cost averaging (DCA) means buying a fixed dollar amount on a fixed schedule, no matter the price. Instead of putting $4,800 into silver on one day, you might buy $200 worth every month for two years.
Because the dollar amount stays the same, the number of ounces you get changes with the price:
- When the price is high, $200 buys fewer ounces.
- When the price is low, the same $200 buys more ounces.
Over time you end up holding more of the ounces you bought cheaply, and fewer of the ones you bought at a peak. That pulls your average cost per ounce below the simple average of the prices you paid.
Why stackers like it
Most people who stack bullion aren’t trying to trade the next move in spot. They want to own more metal over the years. DCA suits that goal for a few reasons:
- It takes timing off the table. Nobody knows whether silver will be higher or lower next month. A schedule means you don’t have to guess, and you don’t have to watch the chart every day.
- It fits a budget. A set amount each paycheck or each month is easier to plan around than one large purchase.
- It keeps you buying. A rule made in advance is harder to talk yourself out of when the news is gloomy or prices have jumped.
None of this guarantees a profit. If prices fall and stay down, a DCA stack is worth less than it cost, just like any other purchase. What DCA changes is the price you pay on average, not where the market goes.
Why a falling price makes a DCA stacker happy
This is the part that surprises people. When a stacker who buys on a schedule sees the price of silver drop, the usual reaction is not panic. It’s closer to “good, this month’s $200 goes further.”
Here’s an illustrative six months of buying $200 of silver each month, with spot dropping and then partly recovering. Premiums are left out to keep the math clear.
| Month | Spot price | Ounces bought | Total ounces | Total spent | Average cost per oz |
|---|---|---|---|---|---|
| 1 | $52.00 | 3.846 | 3.846 | $200 | $52.00 |
| 2 | $48.00 | 4.167 | 8.013 | $400 | $49.92 |
| 3 | $44.00 | 4.545 | 12.558 | $600 | $47.78 |
| 4 | $42.00 | 4.762 | 17.320 | $800 | $46.19 |
| 5 | $46.00 | 4.348 | 21.668 | $1,000 | $46.15 |
| 6 | $50.00 | 4.000 | 25.668 | $1,200 | $46.75 |
A few things stand out:
- Every dip bought more silver. The $200 in month four bought nearly an ounce more than the $200 in month one.
- The average cost kept falling while the price fell. By month four the stacker’s average was $46.19, even though they started at $52.
- The average beats the simple average of the prices. The six prices average out to $47.00, but the stacker’s real average cost is $46.75, because the cheap months bought more ounces.
- The stack is ahead even though the price isn’t back. At $50, the 25.668 ounces are worth $1,283, about $83 more than the $1,200 spent. Someone who put all $1,200 in at $52 in month one would own 23.077 ounces worth $1,154, and would still be waiting to break even.
That’s why many DCA stackers treat a falling market as a sale. The lower the price goes while they’re buying, the lower their average cost, and the less the price has to recover for the whole stack to be in profit. The habit only works if you keep buying through the dips, which is exactly when it feels hardest to do.
Planning a schedule with the DCA calculator
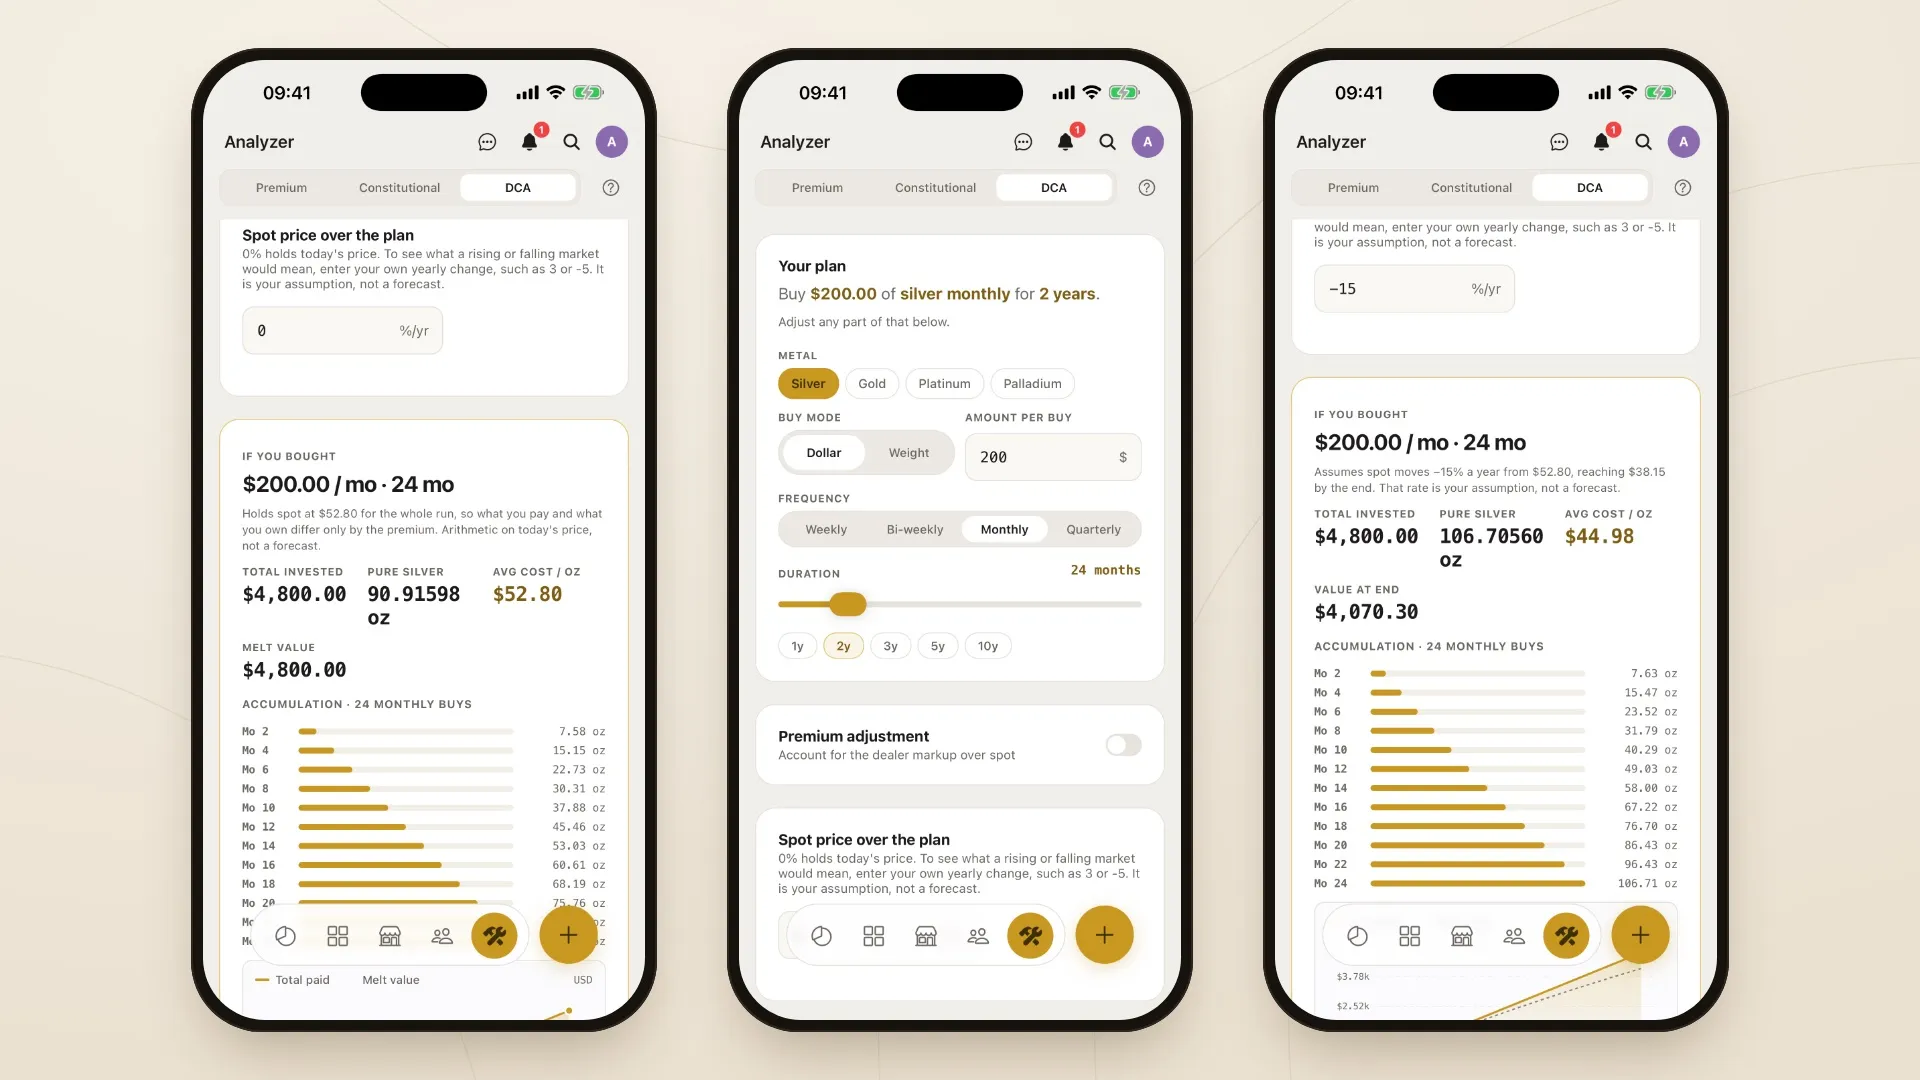
My Coin Stack has a DCA calculator built into the Analyzer. Open Tools → Analyzer and choose DCA. You describe a plan in plain terms, and it shows what that plan adds up to at today’s live spot price.
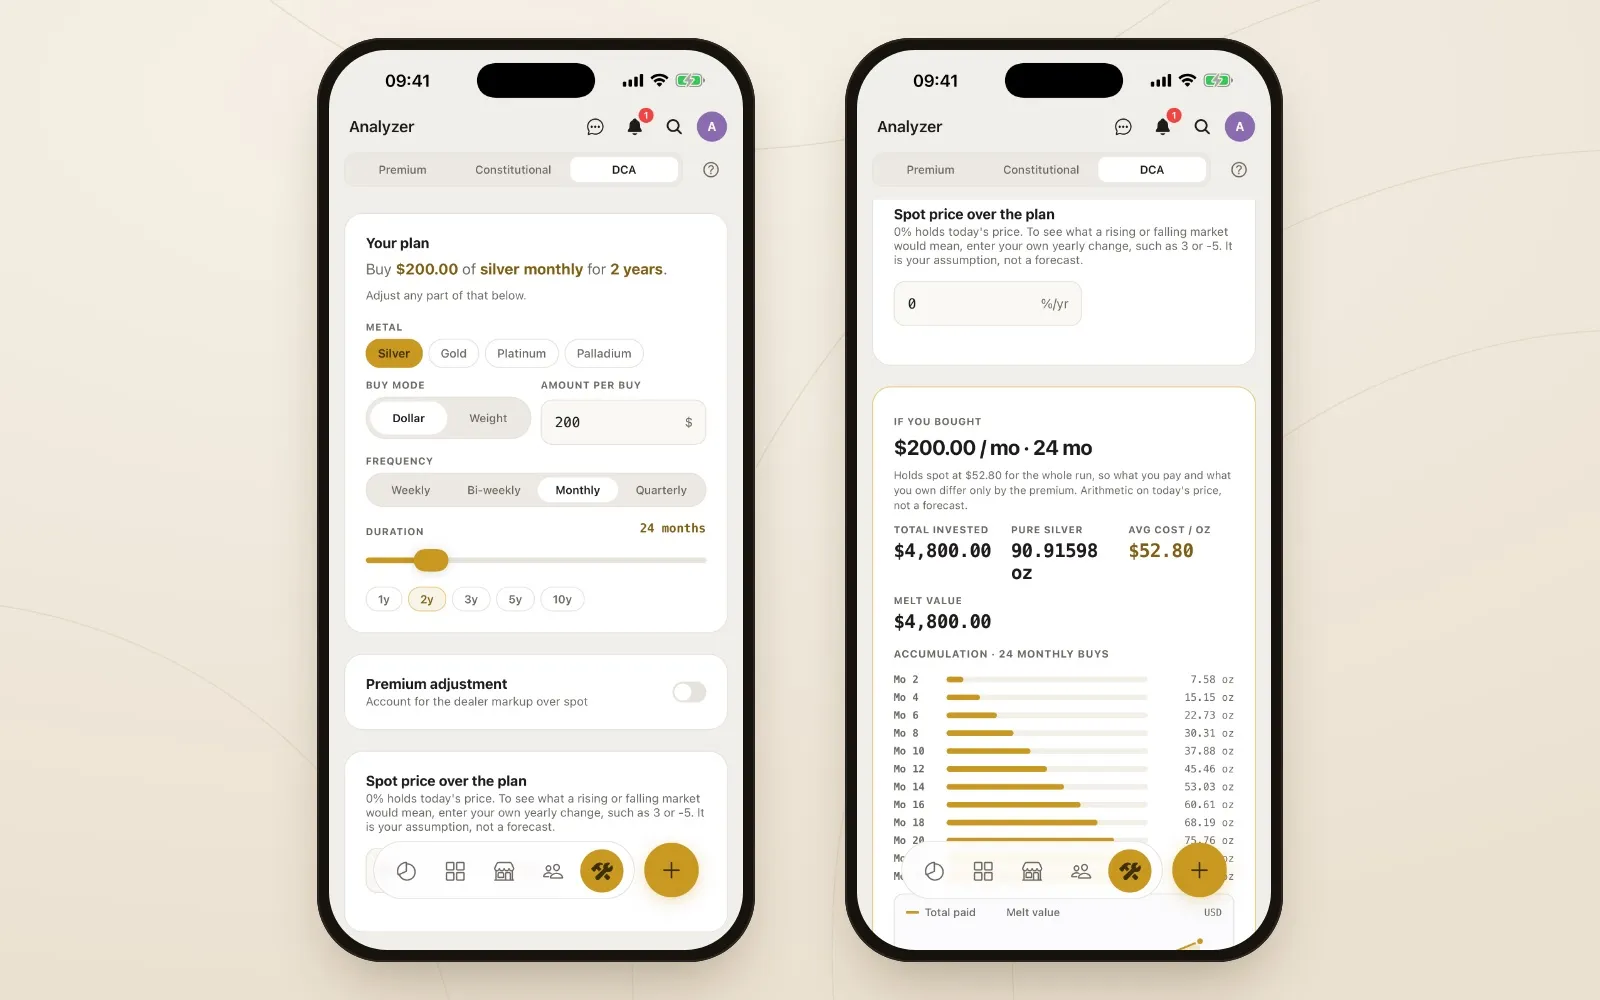
Set the plan on the left. The projection on the right updates as you change it.
You can set:
- The metal: silver, gold, platinum or palladium.
- How you buy: a fixed dollar amount each time, or a fixed number of ounces.
- How often: weekly, bi-weekly, monthly or quarterly.
- How long: anywhere from 6 months to 10 years, with quick buttons for 1, 2, 3, 5 and 10 years.
- The premium: turn on the premium adjustment to add the dealer markup you actually pay, as a percentage or a flat dollar amount per ounce. If you’re not sure what that should be, our guide to calculating the premium over spot walks through it.
The projection then shows the total you’d invest, the pure ounces you’d end up with, your average cost per ounce, and what that metal is worth. Below that, an accumulation list shows how the ounces build up across the plan, and a chart compares the total you’ve paid with the melt value of what you own.
Testing a falling market
By default the calculator holds spot at today’s price for the whole plan, so it’s simple arithmetic with no forecast built in. To see what a rising or falling market would mean, enter your own yearly change in Spot price over the plan, such as 3 or -5. The app never supplies a rate of its own, so the number is always your assumption.
Here’s the same $200-a-month silver plan side by side. On the left, spot holds at $52.80. On the right, spot falls 15% a year, ending the two years at $38.15.
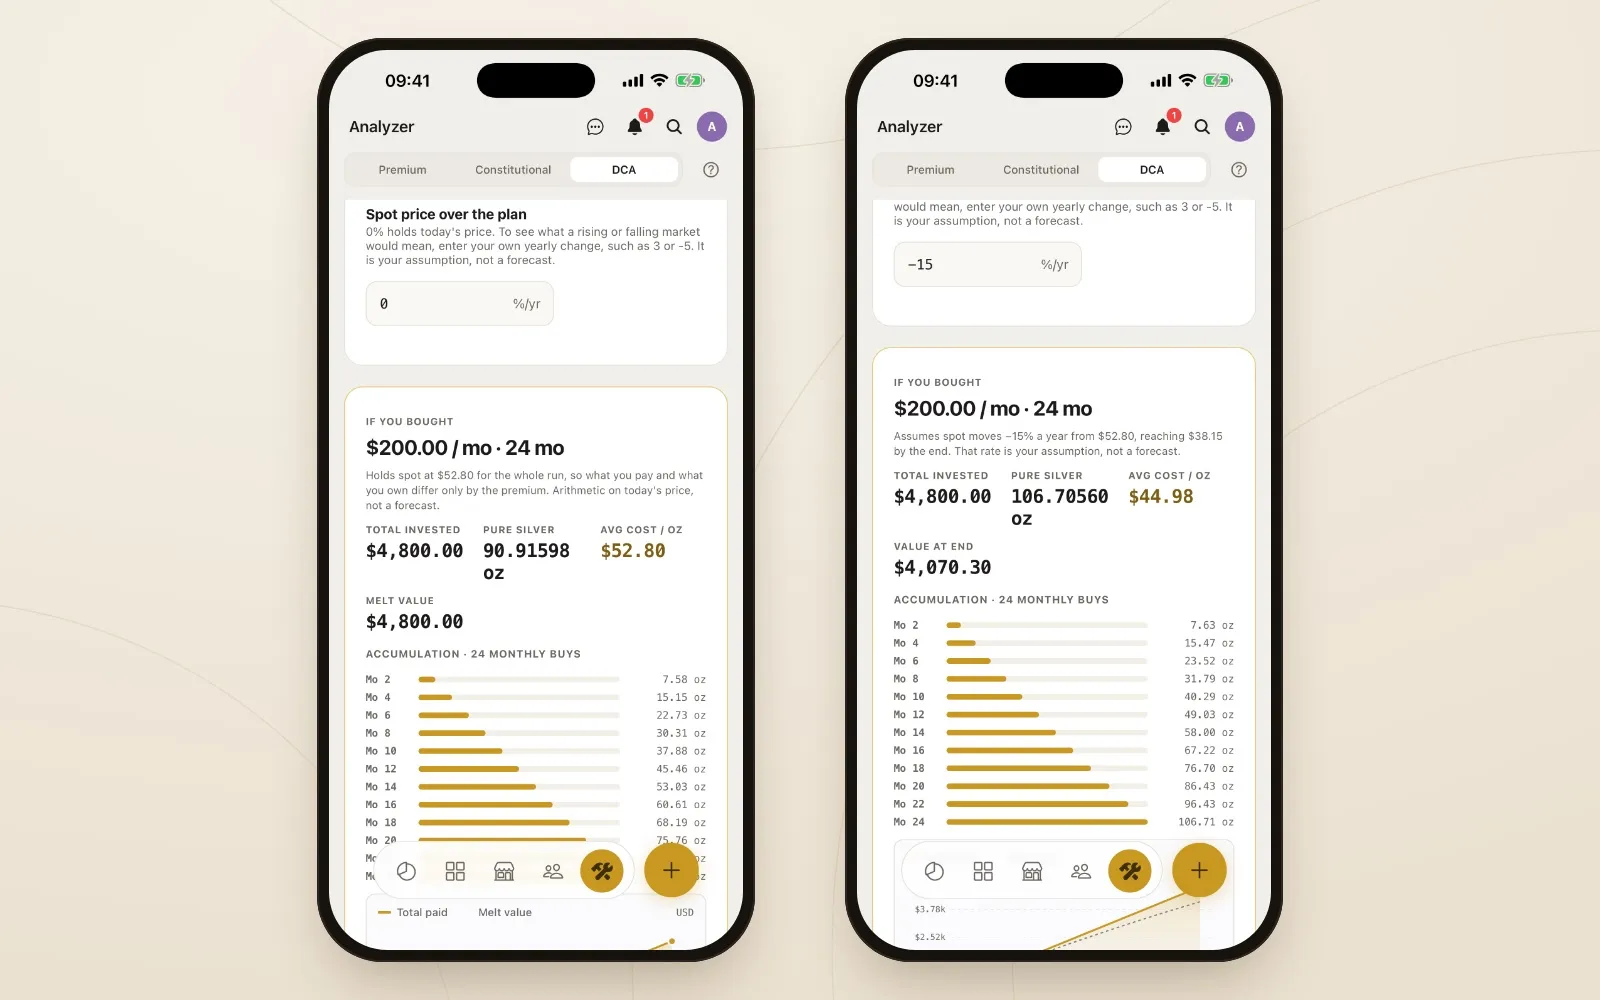
Same budget, same schedule. A falling price buys about 15.8 more ounces and drops the average cost to $44.98.
The $4,800 is the same in both. But in the falling market, the stacker ends up with 106.71 ounces instead of 90.92, at an average of $44.98 an ounce instead of $52.80. At the low end-of-plan price the stack is worth less than it cost, and the calculator says so plainly. If silver later comes back to $52.80, though, those 106.71 ounces are worth about $5,634, roughly $834 more than was spent. The flat-price plan, at that same $52.80, is worth exactly what it cost.
That’s the DCA stacker’s view of a falling price in one picture: more metal for the same money, and a lower bar for the whole stack to be in profit.
Tracking the stack you actually buy
A plan is only the start. Once you’re buying every month, the useful questions change: What have I spent in total? What’s my real average cost? What is all of this worth today? Am I ahead or behind?
That’s where tracking a bullion stack as an investment gets tedious, and where most people reach for a spreadsheet.
The trouble with a DCA spreadsheet
A spreadsheet works for the first few rows. A DCA habit means a new row every week or month, for years, and every row is another chance for something to go wrong:
- Typos in the data. A price entered as $529.00 instead of $52.90, an ounce typed as a gram, or a purchase entered twice. Each one quietly throws off every total built on it.
- The wrong average. A common mistake is averaging the purchase prices with
=AVERAGE(). For DCA that’s the wrong number. Your real average cost is total spent divided by total ounces, which weights the cheap months properly. In the table above, the simple average says $47.00; the true figure is $46.75. - Formulas that drift. Add a row below the range a
SUMcovers and that purchase simply isn’t counted. Sort one column without the others and a price lands on the wrong purchase. - Stale spot prices. The value of the stack depends on a spot price someone has to type in. When it’s three weeks old, so is every total, and gold, silver, platinum and palladium each need their own.
- Premiums and fees get lost. Shipping, premiums and card fees are part of what you paid. In a spreadsheet they often live in a notes column, or nowhere.
We’ve covered this in more detail in coin spreadsheet vs. an app. For a DCA stacker the problems compound, because the spreadsheet only grows.
Live spot prices and reports instead
My Coin Stack treats your stack as an investment from the moment you add it. Each purchase records what you paid, and the app values everything at live spot prices for gold, silver, platinum and palladium, with each metal’s move since the previous close. Nothing to type in, and nothing goes stale.
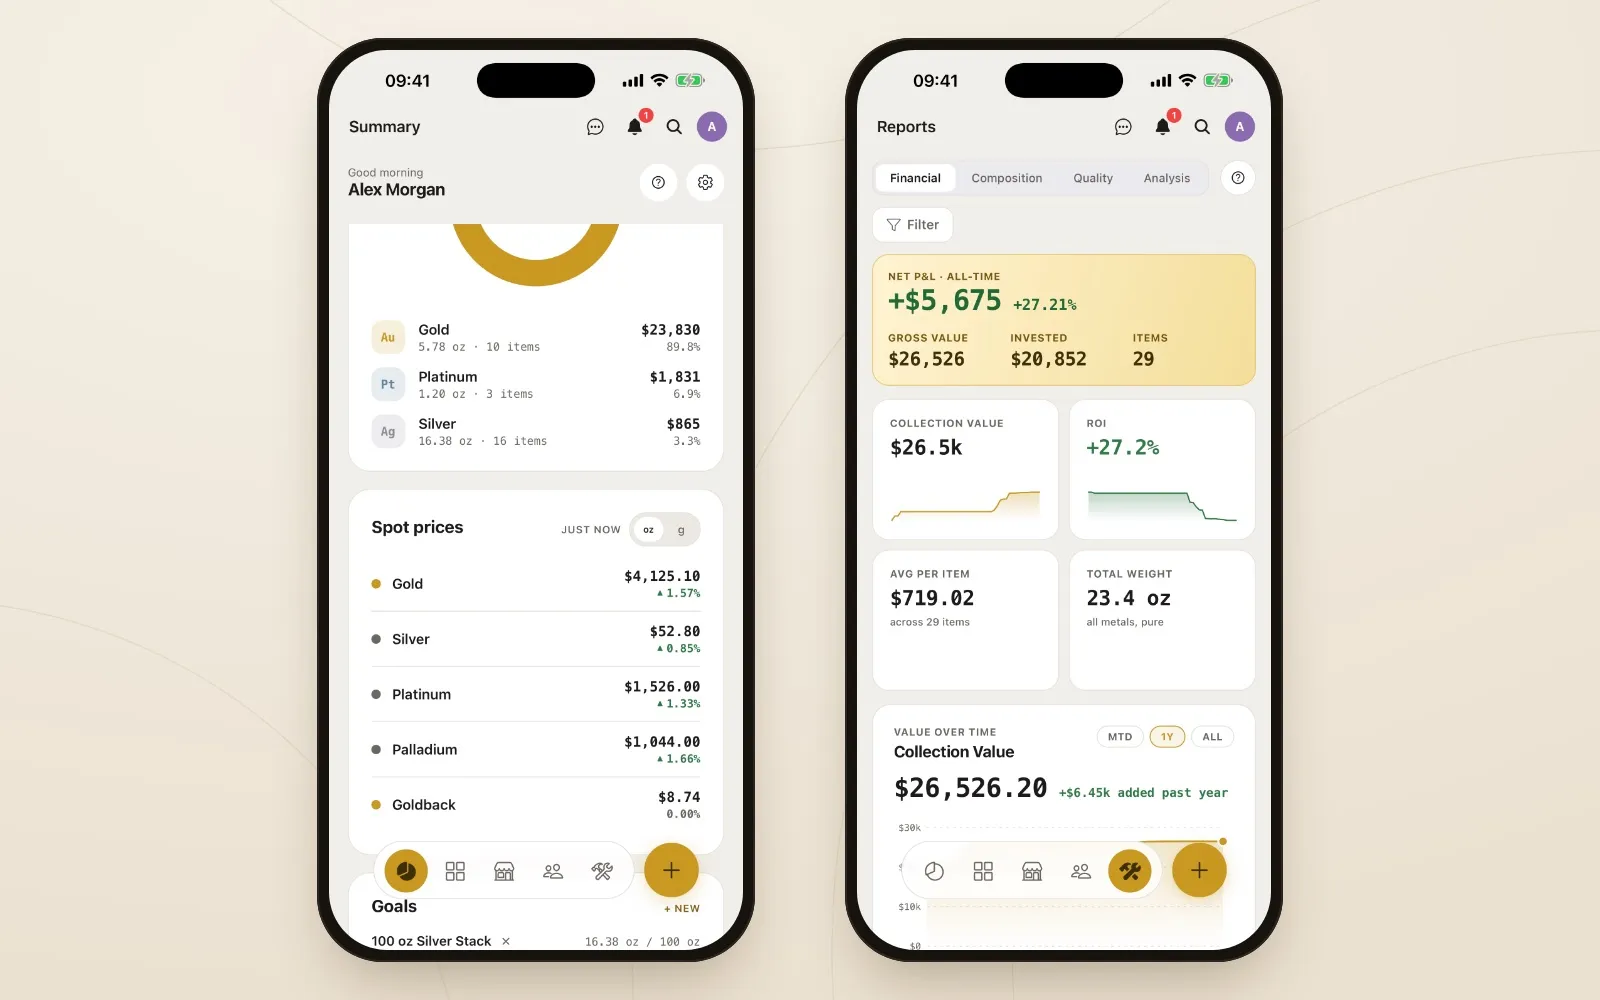
Live spot prices on the left, and the Financial report built from them on the right.
Reports does the arithmetic a spreadsheet would make you build by hand:
- Financial: net profit or loss, collection value, total invested, ROI, average cost per item and total weight, with a chart of value over time.
- Composition: how the stack breaks down by metal, style, country and vendor.
- Quality: which records are missing a price, photo or grade, so your totals stay honest.
- Analysis: the premium you’ve paid over melt, charted over time.
Because the totals come straight from your purchases and the live price, there’s no formula to break and no range to extend. Filter by vendor or tag and you can see, for example, how this year’s monthly buys are doing against the rest of the stack.
It works in any browser, on mobile and on your TV, and stays in sync across all of them. You can add this month’s purchase on your phone at the coin shop and see it in your reports at home. If you already have a spreadsheet, My Coin Stack imports from CSV and Excel, so your history comes with you.
A few practical tips
- Count the premium. A 1 oz silver coin with a high premium can cancel out much of what a dip saves you. Set the premium adjustment in the calculator to what you really pay, and compare products with the premium calculator before you buy.
- Choose a schedule you can keep. The benefit comes from buying through the low months. A smaller amount you’ll stick with beats a larger one you’ll skip.
- Record every purchase as you make it. Your average cost is only as good as the data behind it. Adding each buy right away, with its real price, keeps the reports accurate.
- Plan for storage and selling. Ounces add up. Think about where they’ll live and which products will be easiest to sell later. Our comparison of gold coins and gold bars covers the resale side.
The bottom line
Dollar cost averaging is a simple habit: the same amount, on the same schedule, whatever the price. When prices fall, a stacker doing it keeps buying, gets more ounces for the money, and brings their average cost down. When prices recover, the whole stack benefits.
The DCA calculator in My Coin Stack lets you plan that schedule and test a rising or falling market before you commit. Once you’re buying, live spot prices and Reports show your real average cost and returns, without a spreadsheet to maintain. The Analyzer, including the DCA calculator, is free on every plan.
This article is general education, not personal investment advice. Precious metals prices go down as well as up, and no buying strategy guarantees a profit.
Keep reading
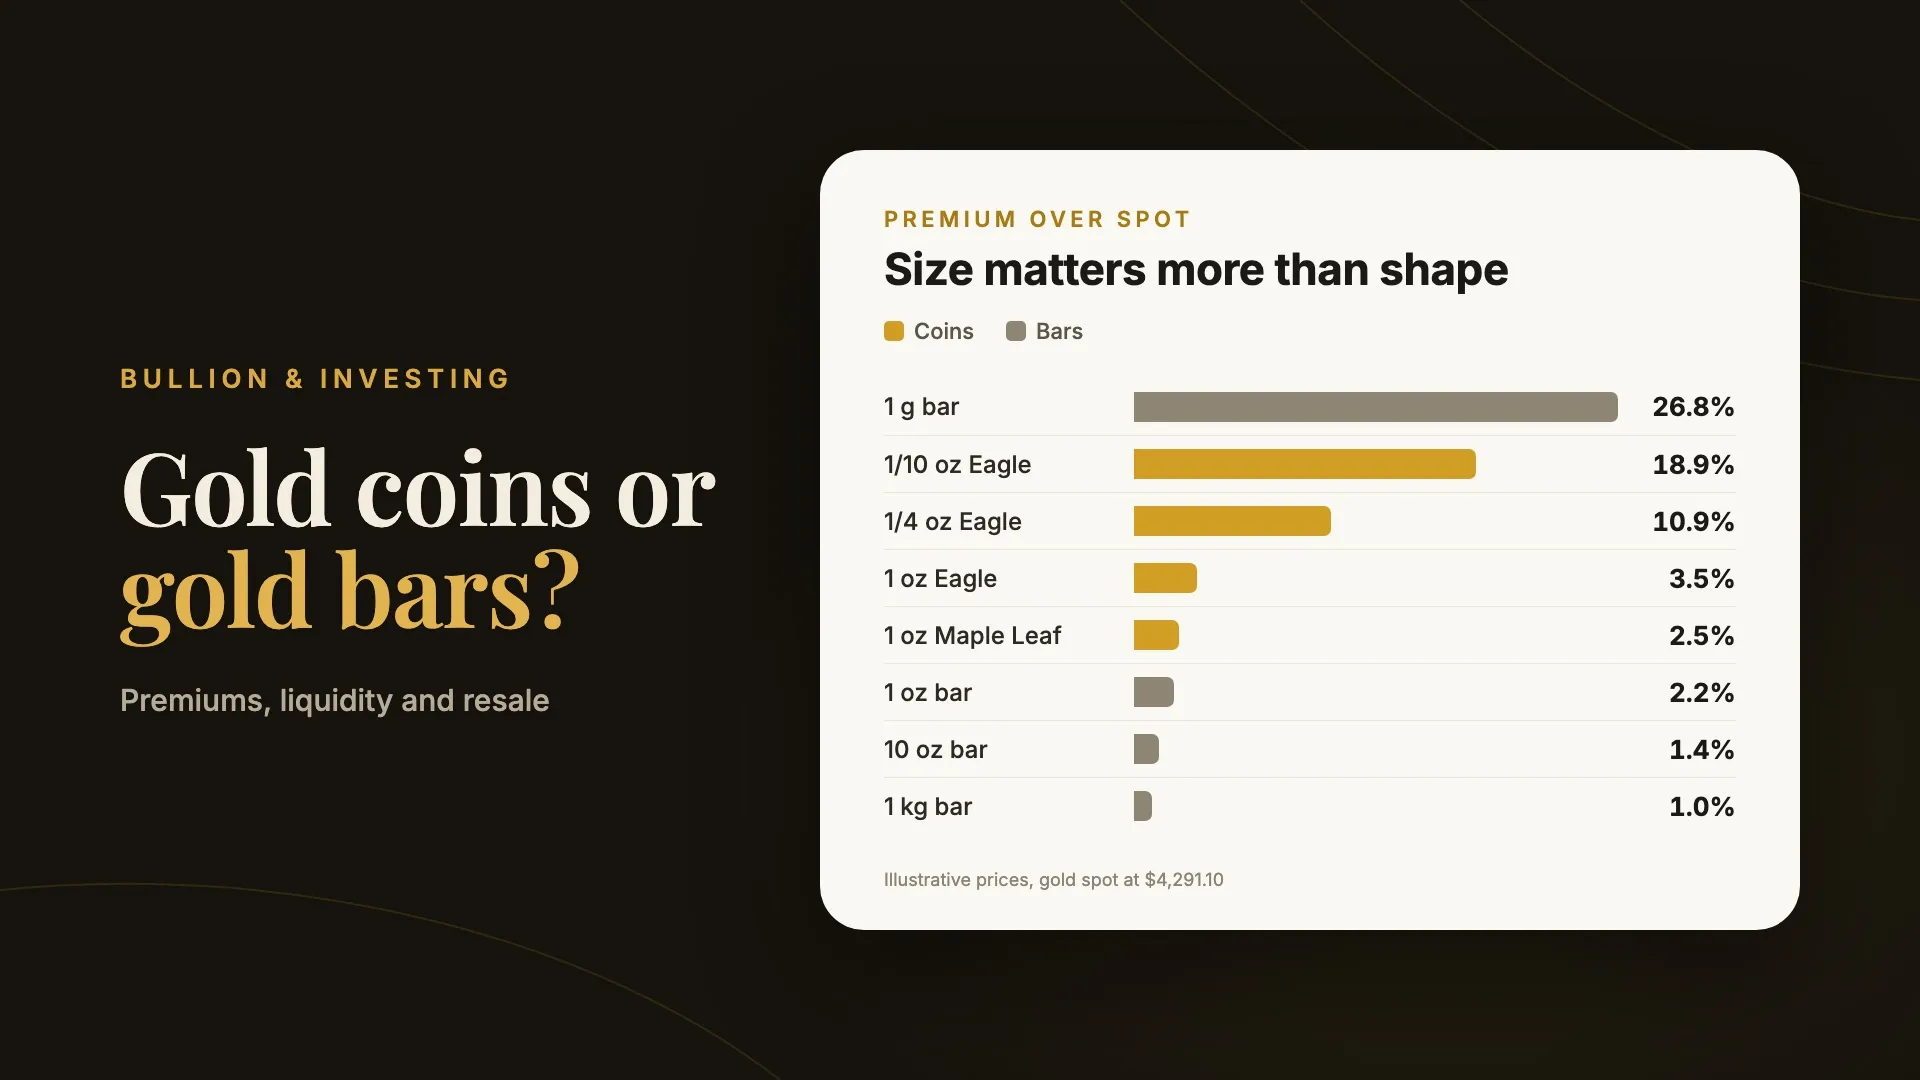
Gold Coins vs. Gold Bars: Premiums, Liquidity and Resale
What you pay over spot for gold coins and bars at each size, how easily each one sells, and why the cheaper option to buy isn't always cheaper to own.
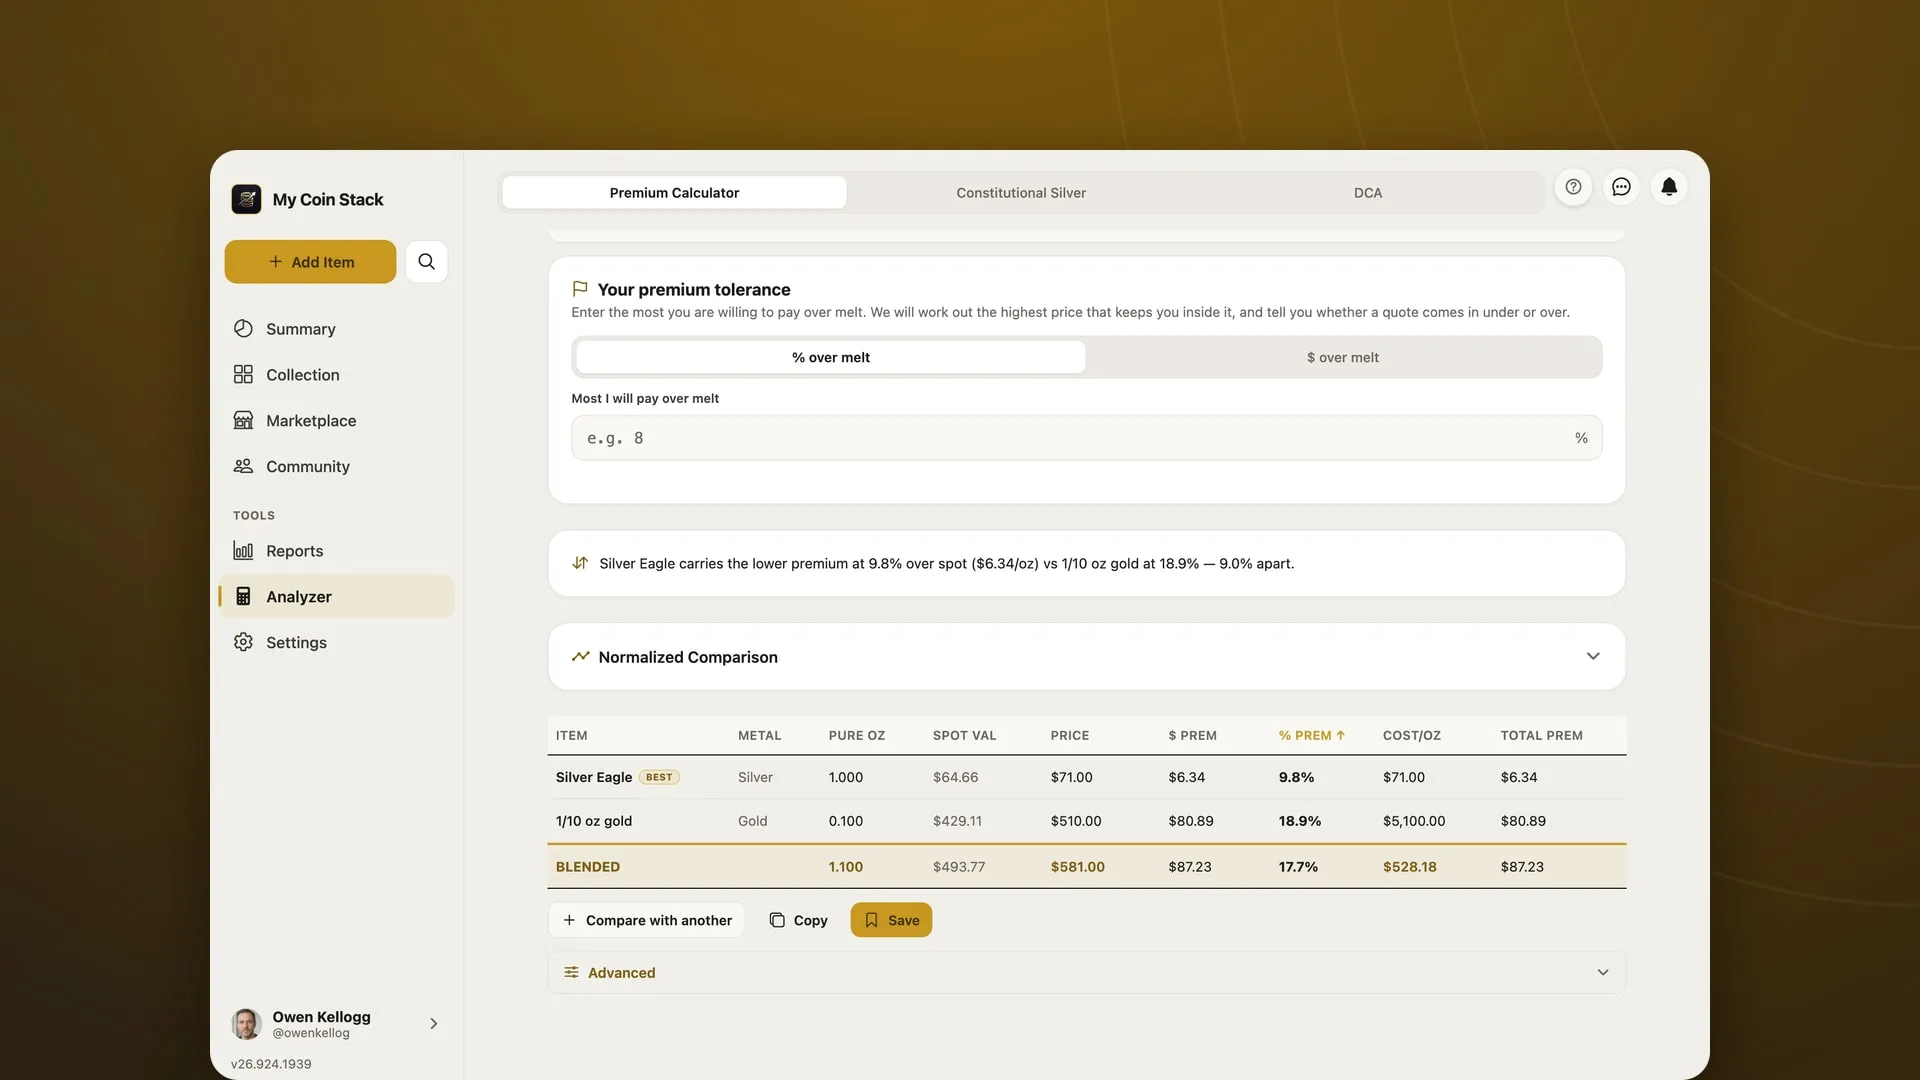
How to Calculate the Premium Over Spot Before You Buy Bullion
The price on a coin is metal plus premium. Here's how to work out each part, compare offers of different sizes fairly, and decide what you're willing to pay.
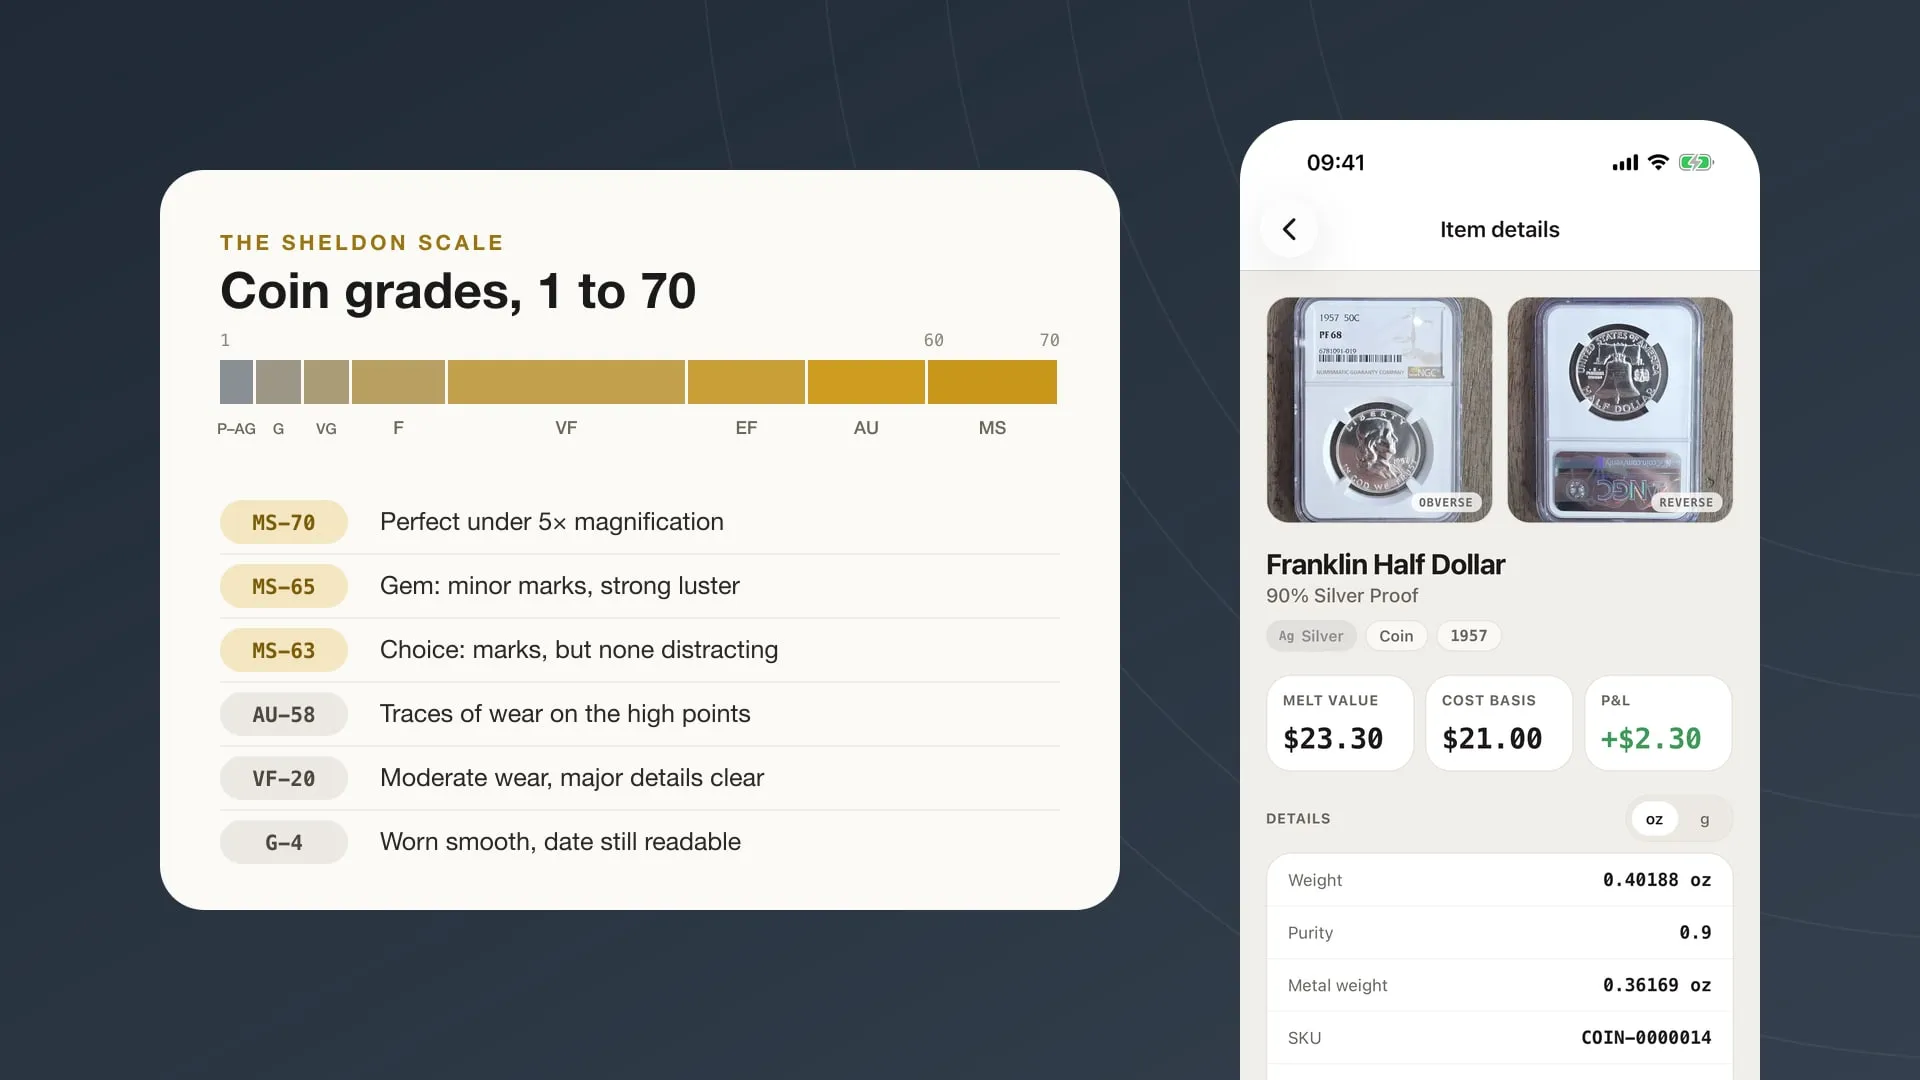
Coin Grading Basics: What MS-63, VF-20 and 'Details' Mean
How the 1–70 Sheldon scale works, what the letters and plus signs on a slab mean, when third-party grading is worth paying for, and how to record grades.

Put it to work on your own stack.
My Coin Stack is free in any browser, with no card required.